Table of Links
II. Background and Related Work
A. Learning to Program: SCRATCH and Pair Programming
B. Gender in Programming Education and Pair Programming
III. Course Design
A. Introducing Young Learners to Pair Programming
B. Implementation of Pair Programming
IV. Method
A. Pre-Study and B. Data Collection
C. Dataset and D. Data Analysis
V. Results
VI. Conclusions and Future Work, Acknowledgments, and References
C. Dataset
A total of 139 children, 56 girls and 83 boys, from six different schools participated in the course. Of these, 32 students attended an elementary school and 107 a secondary school in the local area of Passau. The average age was 11.18 years (f: 11.16, m: 11.20) and most students (120) indicated that they knew their pair partner well (a little: 12, not so well: 7). More than half of the children stated that they had no prior programming experience at all (f: 35, m: 45), while 59 students had already programmed a little (f: 14, m: 21) or even a little more (f: 7, m: 17). In total there were 71 pairs, of which 66 were pairs of two (ff: 26, fm: 3, mm: 37). However, due to the absence of individual students in the classes, there were also groups of three and one male individual, which were excluded from the analysis.
D. Data Analysis
To identify gender-dependent characteristics, our independent variable is the pair constellation: all-female, all-male and mixed pairs. To determine the effects of this constellation on the dependent variables of attitude, behavior, and programming outcome, we consider the research questions as follows.
1) RQ1: Attitude: To answer RQ1, we consider students’ survey responses regarding their attitude towards programming and the course design, i.e., enjoyment and difficulty of the tasks and their assigned roles.
a) Attitude Towards Programming: To determine changes in attitude towards programming, we perform a pairwise comparison of whether students think programming is cool before and after the course. We measure statistical differences using a Wilcoxon Rank Sum test with α ≤ 0.05.
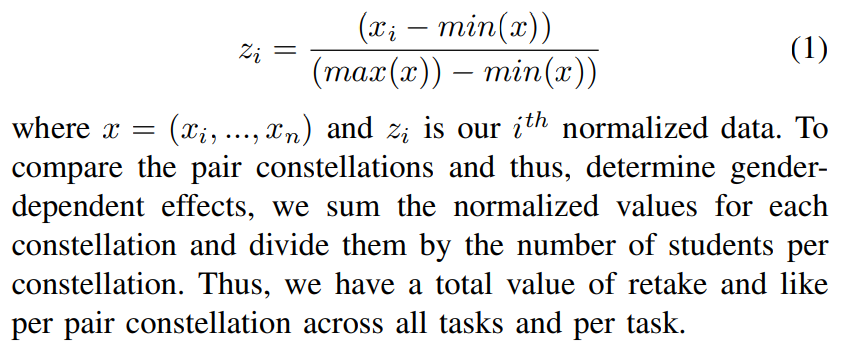
b) Attitude Towards Course Tasks: To measure the overall hedonic quality of the tasks [49], we sum the Likert values of the Again-Again-table AG ([1,3]) and the Smileyometer FU ([1,5]) for each student and task (Table I). The transformation of the Again-Again-table values corresponds to a value range of three gradations, where 1 is the lowest value (no) and 3 is the highest value (yes). The values of the Smileyometer correspond to a 5-point Likert scale, with the best value representing 5 and the lowest value representing 1. For each student and task, we obtain a value in the interval [2,8], assuming they have completed all the tasks—otherwise, the interval is adapted to the completed tasks in order to be able to compare the different pair constellations. The sum of each pair is normalized to [0,1] with the following formula:
In addition, for each pair constellation, we rank the tasks that the students enjoyed the most and least based on their colored stickers. For this, we sum up the number of each sticker of a student for each task and pair constellation and provide the relative number per task. To identify which task the students considered easy or difficult, we use the same method for the stickers for easiest and most difficult task.
c) Attitude Towards PP Roles: To determine whether the students preferred the role of driver or navigator, we consider the feedback from the Smileyometer LR (Table I). Therefore, the sum of the values of each student at the Smileyometer are formed for both roles. Thus, two lists per student are created in the interval [3,15], although with potential deviations, since students may not adhere exactly to the compliance with roles and some tasks may not be processed due to technical problems. These interval values are again normalized to the range [0,1] using Equation (1). After normalization, we compare the values within and between pair constellations for each task as well as for the respective role in total. We measure statistical differences using a Mann-Whitney-U Rank Sum test at a significance level of α ≤ 0.05.
2) RQ2: Behavior: To answer RQ2, we consider the supervisors’ survey responses from the survey regarding the six categories (Table I). We sum the Likert values of each category ([1,5]) for each pair and task. For each pair and task, we obtain a value in the interval [6, 30] per category, assuming they have completed all the tasks—otherwise, the interval is adapted to the completed tasks. These interval values are normalized to the range [0,1] using Equation (1) in order to be able to compare the different pair constellations. These normalized values are then aggregated for each pair constellation and divided by the number of pairs per constellation. Thus, we have six values for each pair constellation, one per category. We again measure statistical differences between the pair constellations using a Mann-Whitney-U Rank Sum test at a significance level of α ≤ 0.05.
3) RQ3: Code: To answer RQ3, we consider the actions performed during coding, and the resulting programs in terms of code metrics, quality, and creativity. To determine how students interact with the SCRATCH environment while programming, we log all their interactions (events) during the course. To evaluate the code of the programs, we use the static analysis tool LITTERBOX [50] to analyze the number and types of the block used, and complexity represented by an interprocedural version of cyclomatic complexity (ICC) based on an interprocedural control-flow graph. To measure the quality of the programs, we determine poorly written code (code smells or bugs) [50] and particularly well-written code (code perfumes) [51]. To evaluate the creativity of the programs, we determine the sprites used and stages of the blocks that differ from our gender-neutral sample and which additional tasks they have chosen in both free tasks (Section III-C5).
Authors:
(1) Isabella Graßl, University of Passau, Passau, Germany ([email protected]);
(2) Gordon Fraser, University of Passau, Passau, Germany ([email protected]).
This paper is